SURFLOOK.COM
Filed under |
Coming in the future to surflook.com:
Surflook.com has its eye on new technology that could be put to use to revolutionize surf reporting. Reporting could model exactly how, when, and what part of the beach a set of waves will break.
There is no greater way to get a surf report than being there at the beach and seeing the conditions first hand from the sand or cliffs, watching the set intervals while scanning the horizon. All aspects and effects of putting technology out there to aid in tracking and catching waves will be carefully considered… including the possibility of overcrowding any particular surf spot.
We’d be greatly honored if you take the journey with us and improve the future of your surfing along with surflook’s bold vision for the future of surfing enjoyment and surf forecasting.
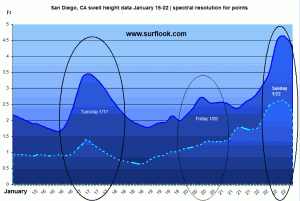
“I have developed a new way of predicting wave heights to within less than 1′ standard deviation for a 9 day period based on what I capture from the data dump of numerous ocean buoys.
Data is massaged in microsoft excel and charted for over a weeks worth of data. My method uses less extrapolation and more data. For now I am working with data and creating graphs for the area along San Diego, Ca coast and analyzing the results. Time permitting I will post and share this data and work on a method of sharing this data with the public.”
– James Dalton – – December 2011
Along with future ocean forecasting development as well as shelving/hiding technology with the wrong impacts… surflook has been shifting attention to wave generating technology and seeking out investors and developers for a perfect spot in inland southern California.
The “pipe” dream of being able to create on demand waves to specific size and shape is very feasible in today’s world.
Interested investors, developers and other interested parties please contact surflook.com to pursue further opportunities.
Fishing sea surface temperatures
Filed under |, Sea Surface Temperatures Fish Report
Southern California West Pacific and Global Temperatures


Click here for The Unclassified Navy sea temperatures chart
Fish Charters Data observation helpful for sport fishing data collection and rout planning
How to tell if a fin above the water belongs to a shark or dolphin
Filed under Contributed Articles
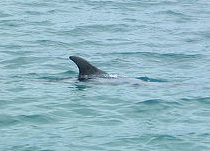
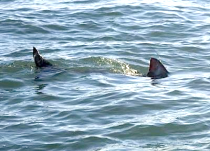
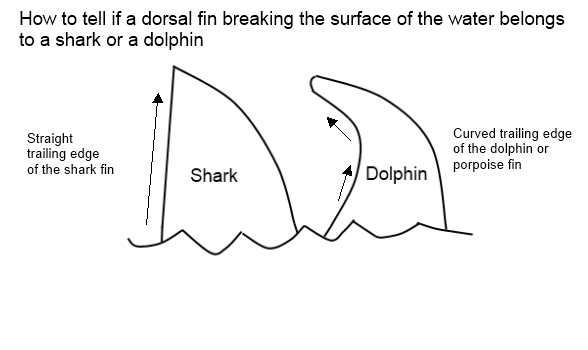
A sharks dorsal fin will have a straighter trailing edge while the dolphin and porpoise have a very curved trailing edge dorsal fin.
You can also feel confident in being able to spot a shark fin by knowing the sharks tail fins are vertical and sometimes break the surface ever so slightly behind the dorsal fin. Dolphins, porpoises and whales tail fins are horizontal. Many shark species also have the second small dorsal fin close to the tail that may be seen protruding from the water. See descriptive drawing below.
The ocean garbage patches
Filed under |
The ocean garbage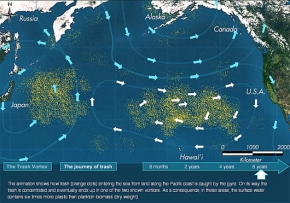 patches 2007, June
A great catastrophe and human error exists in the pacific, eastern pacific and Atlantic oceans that is nothing less than devastating and mortifying when one learns about it for the first time.
For now for some it could be out of site or mind but it is looming out there like a science fiction monster growing bigger and bigger and getting closer and closer to being on your doorstep with no known solution to making it go away.
Most descriptions of a patch of garbage the size of Texas somewhere out there in the pacific ocean are merely trying to put into perspective the mass of garbage actually bigger than the size of Texas (and growing) that collects where the ocean currents and jet streams cross and meet out there in the ocean.
This problem affects mankind in many ways from the fish and seafood we eat to the health of the ocean eco system and earth itself.
More disturbing still is the fact is that there is no known way to clean this up. Besides the expensive monetary cost any operation would be to clean it, there is no known viable way to clean it all up due to the shear mass of it and the way it is spread out all over wide and deep in the oceans. Below the pictures are links to some pictures and articles on the subject and organizations/efforts trying to deal with this problem.
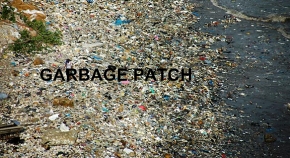
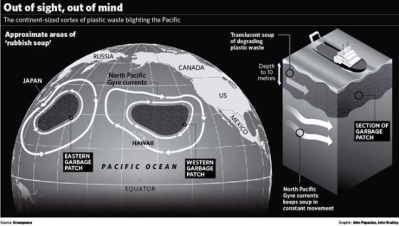
NEW
Video posted 9/2013
Surf Park Summit 2013
Filed under |
The very dynamic interactive and graceful sport that started with local islanders in the islands of the pacific is now on the verge of being enjoyed by anyone in Anytown USA / Anytown Planet Earth.
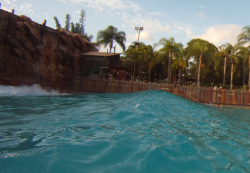 This September surfers, legends, engineers, researchers, developers, and investors will descend into Laguna beach to the seven degrees venue for the Surf Park Summit.
Event attendance is by invite only and ticket prices increase as the event draws closer.
Request an invite and get more info at the surf park summit website here
The technology has long been there and there are many companies with different ways of doing it. The innovation has developed nicely over the past decade.
The wavegarden park is already being surfed in the basque country in Europe and 2 new parks are underway in Bristol and the Isle of Wight. See the video below.
Along with future ocean forecasting development as well as shelving/hiding technology with the wrong impacts… surflook has been shifting attention to wave generating technology and seeking out investors and developers for a perfect spot in inland southern California.
Interested investors, developers and other interested parties please contact surflook.com to pursue further opportunities.
Ventusky InMeteo surf forecast tool
Filed under InMeteo surf app
The Ventusky web application has been developed for you at our company, InMeteo, in collaboration with Marek Mojzík and Martin Prantl. We are a Czech meteorological company based in Pilsen. At our company, we focus on weather prediction and meteorological data visualisation. We have a wealth of experience in presenting weather data from our portal, In-počasí, which was founded in 2006 and is now one of the highest-traffic servers in the Czech Republic. We decided to take advantage of our knowledge and experience and create a top-quality application that clearly displays meteorological data from around the world and allows you to monitor weather development for any place on earth.
The Earth’s weather functions as an interdependent system. For example, a hurricane in the Atlantic has the ability to influence the distribution of pressure formations in Europe. Occasionally, it may even make its way to Europe itself as a post-tropical storm. The Ventusky application allows for the illustration of the interdependence of the entire system, displaying the development of pressure, wind, cloud cover, precipitation, and temperature on the map.
For visualisation of wind data, we utilise current lines that are used to illustrate the movement of particles in liquids. Air and liquid have many similar physical properties, and, as published by Fernanda Viégas and Martin Wattenber (Hint.fm, 2012), current lines are suitable for illustrating wind as well. Because of this, the map depicts wonderful formations illustrating pressure lows that draw in the air around them. We have created an entirely new system of displaying waves. Through the use of animated arcs, our visualisation clearly differentiates the direction of movement and height of both wind waves and swells. For the other meteorological elements, we chose colour scales that appropriately illustrate precipitation, air pressure, and temperature. The colours correspond with the feeling that the given weather phenomena evokes in us. For temperature, blue illustrates cool weather while dark red depicts hot desert air. For precipitation, we concentrated on the danger associated with it. Blue colours represent low precipitation totals that will not result in floods. Orange and red hues, on the other hand, are dangerous and may bring flooding.
The name itself, Ventusky, is a combination of two words. The first is the Latin word, Ventus, means wind, and the second is the English word, Sky.
The Ventusky application is accessible to anyone around the world, aimed at improving awareness about meteorological events in our atmosphere. Images from the application can be redistributed with source and thus help us achieve our goal.
Live Contests
Filed under Live Contests, Surfing
|
|
July – August – US open live Huntington
August – Billabong Pro Teahupoo Tahiti September – Hurly Pro Lower Trestles |
Hotel and flight deals
Filed under Surfing
|
|
 |
Travel video
Nutrition and health for surfers
Nutrition and health for surfers
Everything you need.
Slater wins 2013 Pipe Masters
Filed under |
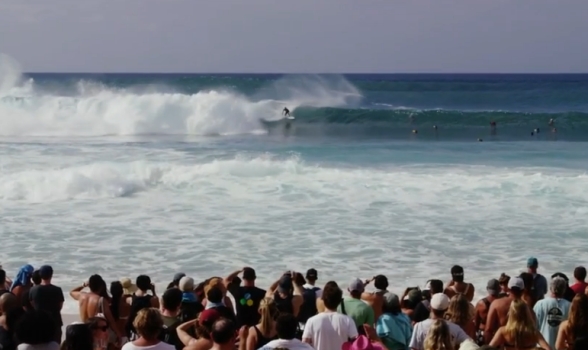
Kelly Slater pulled off a win at the pipe masters on Saturday in an exciting day of surfing that crowned Fanning champ and looked like John Florence would win the Hawaiian triple crown event with some amazing rides. The pipe masters event is complete for the year but you can always watch the live waves at pipeline beach here on the HD live cam on surflook.com
Visit the pipe cam page at
http://www.surflook.com/live-surf-cams-free-hd-and-non-hd/hawaii/oahu/pipeline/
